The end of 2025 brings a final count of 232 shootings at k-12 schools with 204 victims who were killed or wounded.
Both the number of shootings (blue) and the number of victims (green) are significant reductions from the post-COVID closure peak.
On the bottom, the gray color is a composite index calculated by normalizing annual incident counts and annual victim totals separately to a 0–1 scale (dividing each by its historical maximum), and then averaging the two normalized values with equal weight. This produced a single yearly measure that captures both the frequency of events and the severity of harm without allowing either dimension to dominate the trend on its original scale.
So why was there a sharp decrease in 2025? I don’t know. Crime trends are something that needs to be measured across decades to see patterns (which conflicting research shows we don’t really understand at all). I see articles about averted attacks, threats, and students arrested with guns on campus every single day so the potential for a bad outcome is constantly present.
As I’ve written many times, ‘active shooter’ is an invented term that doesn’t have a legal or standard definition. It’s generally used to describe some type of deliberate shooting that isn’t related to disputes, domestic violence, drugs, gangs, and random gunfire (e.g., drive-by shooting).
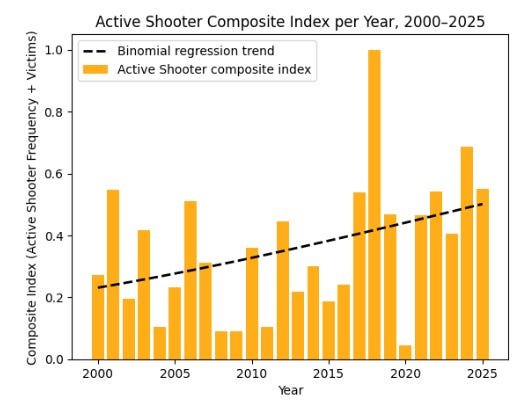
Below is a composite measure with an equal-weighted average of the yearly proportion of incidents classified as ‘active shooter’ and the yearly proportion of victims from those attacks. This measure combines how often active shooter incidents occur with how severe they are into a single normalized index. As you can see from the chart, this trend line has a significant upward trajectory (even with billions invested into fortifying schools).